Tissue detection (simple thresholder)
Pixel classification (tissue regions)
Run for Project
Note that red text!!!!!!!!!!!!!!!!! Also, do not run the script on images containing training data.
Once you have your script for the project all set, test it at least once on an individual image to ensure it works as expected. Then, Run->Run for project in the Script Editor. There is one quirk I want to address with Run for Project, and that is that it does not apply to the Viewer you currently have open. This was very confusing to me the first several times I ran into it, so I will try to explain visually what is happening. The key, though, is that Run for project applies the changes to the Saved file, NOT the temporary file you are viewing. Or, the reason I try to emphasize saving your data is because everything you are doing on the screen is not saved until you save it.
Where this causes problems the most often is when you have Run your script for project, but when trying to click on another image you get a dreaded pop-up… Save changes to “your image”? But.. we just ran a script for project… would saving the data keep what I ran? The answer is.. if you ran a script “for project,” DO NOT SAVE YOUR DATA. As the red text to the right says, you need to reload your data to see it. If you save your data, you are saving what you are currently viewing on top of what the script you just ran did. Sometimes this is fine, as in the case where you tested the script on the current image, and then ran it for the whole project. In other cases, you might have deleted everything to get a fresh start, then Run for project. In that case, saving your data would save the empty current image on top of what the script just completed - removing all that work.
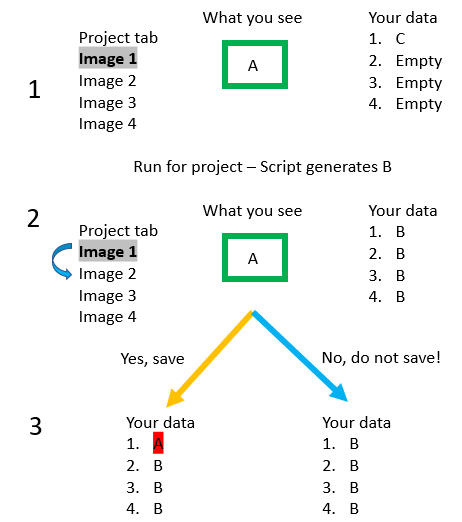
To the right is a visual depiction of the issue. Step 1: you saved your data a while back while playing around, that data is state C (maybe it is just the color vectors). In step 1 you are looking at Image 1, which contains some object A. At some point you finish writing your script, which you Run for project - this generates B in each image and we move to Step 2. However, what you see on the screen is still A! If you try to go to Image 2 (blue curved arrow), you will get the popup asking if you want to save. If you save (orange arrow), you will overwrite the B that is currently saved in image, but if you do not save, you will retain the B in your saved data.
If you return to Image 1 later without saving, you will see B, the result of the script. If you do click save, when you come back to Image 1, you would see A.
Now that we have all of the steps worked out, the hard part is done. As ever, though, go back through your results visually after analyzing the whole project - I cannot emphasize enough how subtle changes you might think should have no effect will suddenly throw things out of wack. One slide might have a bit of permanent marker on it, throwing off how your threshold performs, or there might be large flecks of skin embedded in the fixative on another slide. Or maybe the bulb is dying in the whole slide scanner and no one else thought to check the images before passing them on to you.
Pipelines are dangerous, especially if unattended. I recommend adding in some warnings for extreme cases: for example 100% of cells being positive, 100% of tissue being one class, or 100% of the imaged area being tissue might all be indicators that something is wrong.
 Warning
Export summary measurements
Before digging into that, lets get the measurements exported. Measure->Export measurements is what we will use here. While it is possible to script the export of measurements, usually you will only need to do this a couple of times per project, and it can take longer to set up the script than quickly go through the menu. That said, there are specific export options that require scripting - for example if you want to export the “per cell” measurements as individual CSV files rather than one big CSV file.
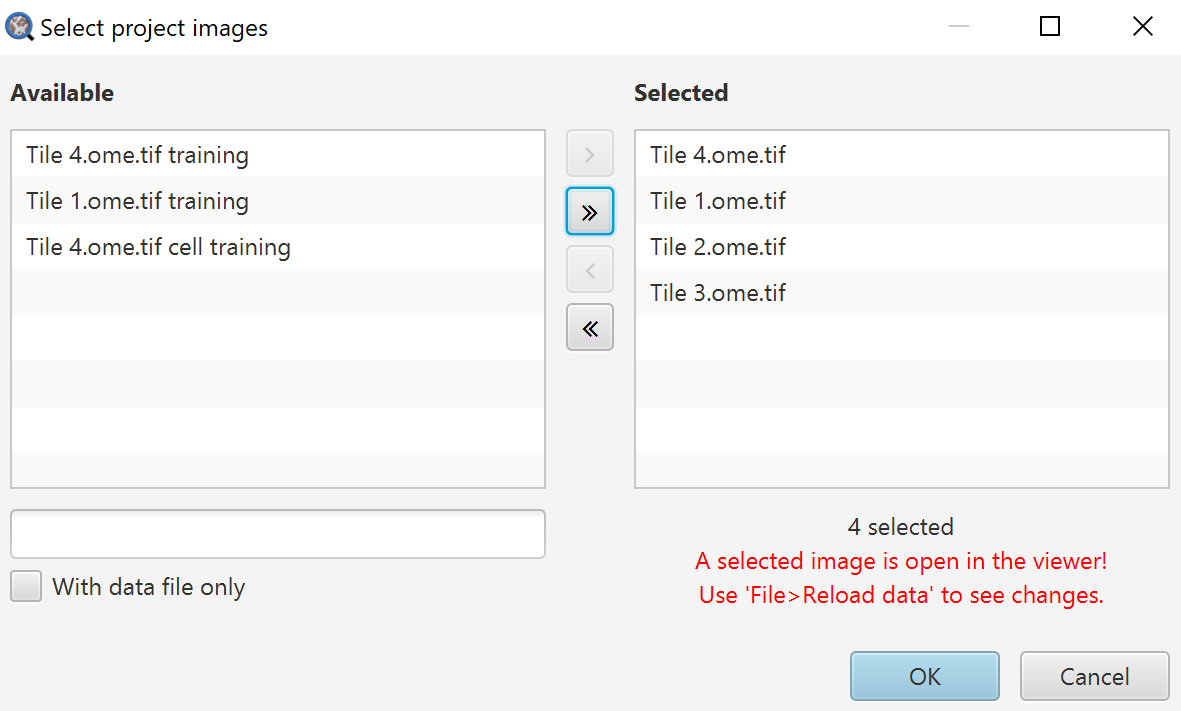
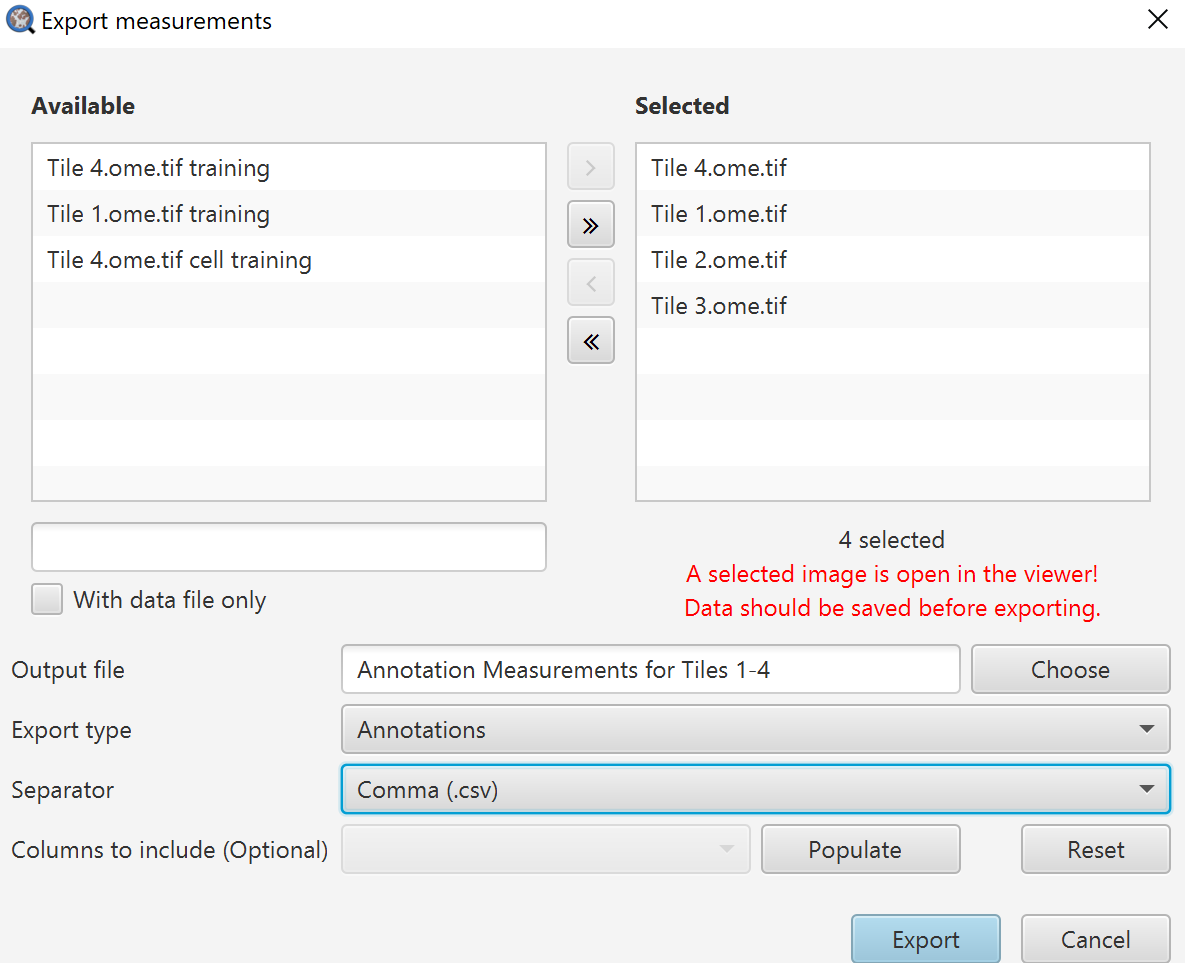
Export measurements dialog
Selected images on the right will be exported, images on the left will not be.
Output file: Name your output file, you do not need an extension here.
Export type: Here you choose whether you want individual cell measurement lists, summary information in the Annotations, or the Image information (which can be seen in the Annotations tab when no annotations are selected).
Separator: I have always found CSV to be the most useful here because, at least in American English versions, Excel does terrible things by default with TSV files. It can be fixed in the settings, but I generally prefer to advise things that will work quickly for most people.
Columns to include: Here you can choose to only export certain columns. If you are digging into this repeatedly, that is when it becomes worth your time to edit a script to handle this all for you. Click Populate first, and then you can right click on the drop down to either select all or none, or go through and select specifically what you want.
Export should ask you to choose a location for your file, and then you get your data!
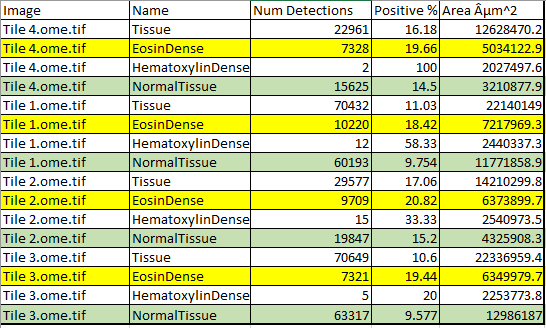
After deleting several columns (or removing them in Columns to include), the results! Areas of various kinds of tissue are generated, along with the percent elongated in EosinDense and NormalTissue. The extra symbol is normal for QuPath exports and can either be fixed or the encoding can be changed in Excel.
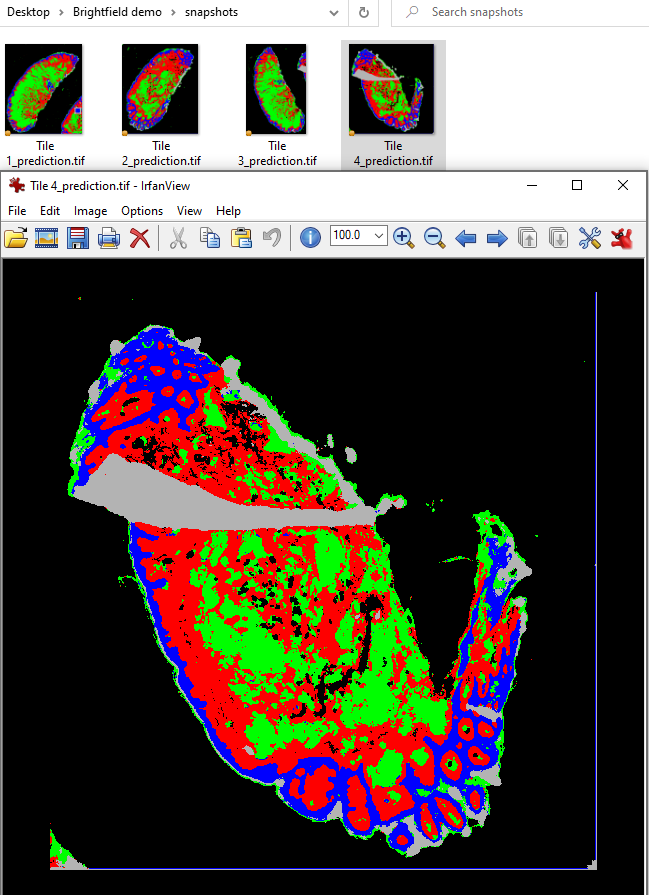
Pixel classifier thumbnails
For large images, especially multiplex whole slide images with millions of cells, opening each image can sometimes be very slow. Some alternatives include checks of the output file (CSV) values, or exporting small visual images that can be quickly opened or skimmed through. This section focuses on exporting pixel classifier results, but there is an entire page devoted to exporting overview images of various types, be they masks, object based results, or heatmaps.
// Write the full prediction image, downsampled 20x
//Code originally from https://forum.image.sc/t/qupath-script-with-pixel-classifier/45597/10
def imageData = getCurrentImageData()
def classifier = loadPixelClassifier('Tissue regions')
name = getCurrentImageNameWithoutExtension()
mkdirs(buildFilePath(PROJECT_BASE_DIR, "snapshots"))
def predictionServer = PixelClassifierTools.createPixelClassificationServer(imageData, classifier)
def path = buildFilePath(PROJECT_BASE_DIR, "snapshots", name+'_prediction.tif')
writeImageRegion(predictionServer, RegionRequest.createInstance(predictionServer, 20), path)
This script, if Run for project, will create a subfolder in the Project directory, and place a PNG file of the each image with the current overlay settings in place, downsampled by 20. If you choose to enable the View->Fill annotations, this script can quickly give you an overview of what annotations have been created within your project. Slotting this into the script right after the creation of annotations results in a script that looks like this:
//This script is currently designed to only detect tissue over 6 million square microns.
//Look at the first number in the createAnnotationsFromPixelClassifier to adjust this behavior

//Remove this line if you need to keep objects that already exist in the image
removeAllObjects()

setImageType('BRIGHTFIELD_H_E');
setColorDeconvolutionStains('{"Name" : "H&E Tile 4", "Stain 1" : "Hematoxylin", "Values 1" : "0.51027 0.76651 0.38998 ", "Stain 2" : "Eosin", "Values 2" : "0.17258 0.79162 0.58613 ", "Background" : " 243 243 243 "}');
//Create the whole tissue annotation
createAnnotationsFromPixelClassifier("Tissue", 6000000.0, 50000.0, "SPLIT")
selectAnnotations();
//Create sub-tissue regions for the hematoxylin dense, eosin dense, normal, and excluded areas
createAnnotationsFromPixelClassifier("Tissue regions", 500.0, 500.0, "SELECT_NEW")

// Write the full prediction image, downsampled 20x
//Code originally from https://forum.image.sc/t/qupath-script-with-pixel-classifier/45597/10
def imageData = getCurrentImageData()
def classifier = loadPixelClassifier('Tissue regions')
name = getCurrentImageNameWithoutExtension()
mkdirs(buildFilePath(PROJECT_BASE_DIR, "snapshots"))
def predictionServer = PixelClassifierTools.createPixelClassificationServer(imageData, classifier)
def path = buildFilePath(PROJECT_BASE_DIR, "snapshots", name+'_prediction.tif')
writeImageRegion(predictionServer, RegionRequest.createInstance(predictionServer, 20), path)


//Add cells to the desired regions and classify them
selectObjectsByClassification("EosinDense", "NormalTissue");
runPlugin('qupath.imagej.detect.cells.WatershedCellDetection', '{"detectionImageBrightfield": "Hematoxylin OD",  "requestedPixelSizeMicrons": 0.5,  "backgroundRadiusMicrons": 8.0,  "medianRadiusMicrons": 0.0,  "sigmaMicrons": 1.5,  "minAreaMicrons": 10.0,  "maxAreaMicrons": 400.0,  "threshold": 0.25,  "maxBackground": 2.0,  "watershedPostProcess": true,  "cellExpansionMicrons": 5.0,  "includeNuclei": true,  "smoothBoundaries": true,  "makeMeasurements": true}');
runObjectClassifier("Elongated cells");
Another option might be exporting an overlay of the actual annotation objects created - this would be useful if run after the tissue detection step since it would show what pieces of tissue were being excluded. The prediction image does not show how size exclusions are resolved. Information on how to write that part of the script can be found on the main documentation site here.
And that is it for now! As ever, contact me on the forum if you have any questions, if you see a region I could improve (I am certain there are many!), or if some aspect of this guide is unclear. And, of course, let me know what more I could add! No promises on a timeline, though :)